Investing in S&P vs. All Seasons – See The Shocking Results
Want to know if you invested in the S&P index vs. the All Seasons Portfolio, which would win?
If you lost money in March of 2020, you are probably concerned about the future of your investments.
I actually invest our family’s money according to the All Seasons Portfolio recommended by Ray Dalio in Tony Robbins’ book Money Master the Game – (CLICK HERE for my post How To Build an All Seasons Portfolio from Money: Master the Game by Tony Robbins).
My results from March 2020 proved to me that I chose wisely, as the market drop of 50% was only a small 3%-5% drop in my son’s All Seasons college education fund.
See the Shocking Results below:
S&P vs. All Seasons Portfolio – Worst Drops 1935 – 2013
Taken from p. 397 from Tony Robbins book, Money Master The Game, here are the results when he had his advisors compare the S&P to the All Seasons Portfolio.
| Year | S&P | All Seasons |
| 1937 | -35.03% | -9.00% |
| 1941 | -11.59% | -1.69% |
| 1973 | -14.69% | 3.67% |
| 1974 | -26.47% | 01.16% |
| 2001 | -11.89% | -1.91% |
| 2002 | -22.10% | 7.87% |
| 2008 | -37% | -3.93% |
As you can see, in the worst drop years, the All Seasons outperforms the S&P by far!
I can personally attest to the March 2020 50% stock market drop as well, as my son’s All Seasons only dropped 3% – 5%.
S&P vs All Seasons (75 Year History 1939 – 2013)
From Tony Robbins book Money Master the Game on p. 396, he shares a comparison over a 75 year history (book was published in 2013).
| S&P | All Seasons |
| In 75 years, the S&P lost money 18 times* | In the same time period the All Seasons portfolio lost money just ten times (slightly more than once a decade, on average).** |
| It’s largest single loss was -43.3%. | The largest single loss was just -3.93% |
| The average loss was -11.40% | The average loss was only -1.63% |
*Includes dividend reinvestment.
**Two of the ten loss years were only 0.03% (essentially break-even years; thus from a practical perspective, there were only 8 years of loss in a 75-year track record).
S&P vs. All Seasons (Including the Great Depression: 1928 – 2013)
On p. 397, Tony Robbins includes a summary of how the S&P vs. All Seasons performed during and since the Great Depression.
| S&P | All Seasons |
| In 87 years (through 2013), the S&P lost money 24 times (roughly 27% of the time). | The All Seasons portfolio lost money only 14 times during the same period (which means 73 years of positive returns). |
| In the heart of the depression, the four consecutive losing years (1929-1932) the S& P lost 64.4%. | During the same four-year period, 1929-1932, the All Seasons portfolio had a total loss of 20.55% (59% better than the S&P). |
| The average loss was 13.66%. | The average loss was just 3.65%. |
*Includes dividend reinvestment
S&P vs. All Seasons Growth
According to Tony Robbins’ book Money Master the Game, the All Seasons portfolio’s annual return net of fees is 9.72% (1984 – 2013).
We already know that is handles market drops much better, but see what that looks like in compounded growth over time in the chart below on p. 398.
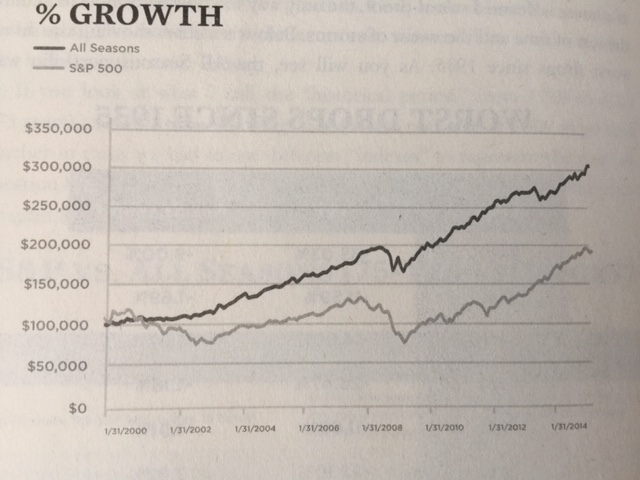
As you can see, the All Seasons is much better than the S&P in growth over a period from January 31, 2000 to January 31, 2014.
With an initial investment of $100,000, it ends the 15 year period growing over $100,000 more than the S&P!!!
Conclusion
For me investing with the All Seasons is a no brainer.
Honestly, I have no idea why so many fiduciaries do not use it.
I decided to create my own All Seasons Investment portfolio for my son when investment advisors wouldn’t help me do it.
It took me I think about a week to figure it out (part time, as I am a full time mother).
It worked so well for my son, that I converted our retirement accounts over to the All Seasons as well.
I also taught my Finance Freedom mastermind members how to do it as well.
I wrote blog posts on how to build (How To Build an All Seasons Portfolio from Money: Master the Game by Tony Robbins) and balance (3 Examples of How To Rebalance an All Seasons Portfolio) the All Seasons Portfolio.
I invite you to learn it and try it for yourself.
I can also ask your fiduciary advisor to implement it for you.
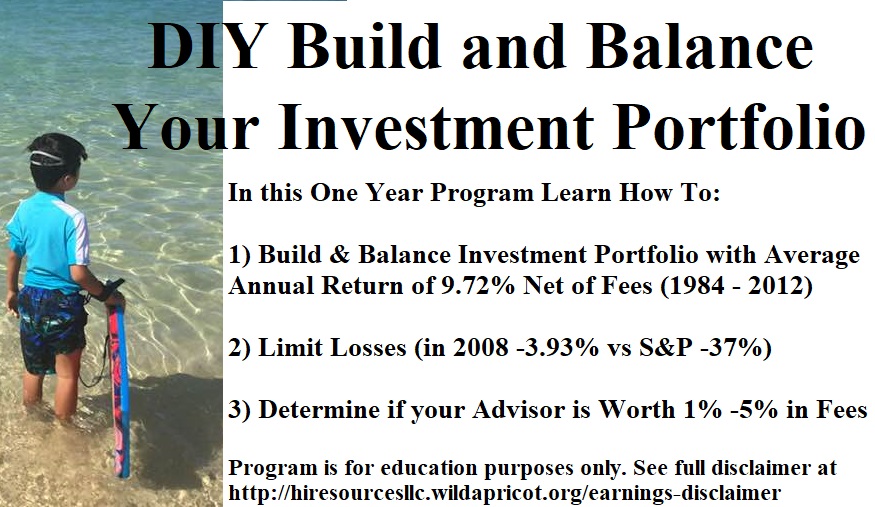
If you need help building and balancing your investment portfolio, I recorded my mastermind sessions for your viewing in the DIY Build and Balance Your Investment Portfolio Program.
I am offering a BETA discount until October 31st, 2020.
For a limited time, you also get access to me on weekly live Zoom office hours on Wednesdays from 6:15am HST / 12:15pm EST for a year.
The office hour is a great way to ask questions or get extra help on building and balancing your portfolio.
If you feel like saving the fees you would pay to an investment advisor and learn how to build and balance your investment portfolio yourself, then take advantage of the discount by clicking here (if you are reading this after October 31st, the price is still great, so check it out)!